I like to have Palladion execute scripts overnight and email the results in a CSV. The issue that I faced was that scripts require you to enter a start and end time. Logging in at 10pm to execute a post dial delay script was not an efficient use of my personal time.
I built the following functions to obtain the current time and then obtain the time from 24 hours ago. Then return these into the format that Palladion expects. You can easily modify the “then()” function to look at a different time range.
import time
import datetime
from time import strptime

def now():
        # This fuction obtains the current time and returns it as a "datetime.datetime" object.
        now = time.gmtime()
        now2 = datetime.datetime(*now[:6])
        return now2

def then():
        # This function obtains the time from 24 hours ago and returns it as a "datetime.datetime" object.
        then1 = time.time()-86000
        then2 = time.gmtime(then1)
        then3 = datetime.datetime(*then2[:6])
        return then3

def run(facade,params):
        #Script entry point.
	start_ts = then()
	end_ts = now()
Palladion is a nice SIP analyzer from IPTEGO. IPTEGO was recently purchased by Acmepacket… so they must be doing something right!
Anyways… here are a few “gotcha’s” that I have noticed while working on extension scripts .
1. If you are trying to compare the time stamps between “Leg.setup_start_ts” and “Message.ts” it becomes tricky. SIP message timestamps from Leg.getMessages are in “Y-m-d H:M:S” format. While Leg.setup_start_ts is in epoch format.You will need to build a function to convert one of these. Check this blog for an idea on how to convert datetime.datetime to epoch.
2. If you can’t seem to get a script to work, check in the “/tmp” directory and look for most recent folder. Review the file named “output” and you will see the traceback output.
3. If you try to do something like :
f = open("/home/me/output.txt", "w")

print >>f, str
It will fail to open the file and the script will stop. If you change “f” to:
f = open("output1.txt", "w")
It should work, and the output will be found in /tmp/”most recent folder”. This is how I discovered the timestamp issue..

Every time I hear “Sham-Link” I can’t help but to think of Vince Shlomi. Maybe he couldn’t make the backdoor link less preferred for CE to CE traffic . Maybe that is what drove him to attack his “date”.
Anyways…
In a service provider network your customer might have a backdoor link from CE to CE that was present before deploying an MPLS VPN for the customer. Or they have asked for redundancy with a point to point link between a major branch and corporate. Whatever the situation traffic might not take the most prefered path right out of the box when using OSPF as the CE to PE routing protocol.
In this case you need a SHAM-WOW…link.
Imagine the following scenario:
                   BGP
 PER1 <-------------------------> PER2
  ^                                ^
O | A                           O  | A
S | R                           S  | R
P | E                           P  | E
F | A                           F  | A
  | 0                              | 0
CER1 <--------------------------> CER2
      OSPF Area 0 (backdoor link)
When reviewing the routes on the network you notice that traffic from CE1 to CE2 is taking the backdoor link. Imagine that this is a point to point T1, while the links to the PER are a 100 meg ethernet connection. Shortest : yes. Most efficient : No. You change the OSPF costs, bounce the OSPF process and still no changes.
If you look at the type of type of routes, you will see that the CE to CE routes are INTRA-area, while the path across the PE / P network is seen an an External area (mismatch ospf domain) or inter-area. Hence the problem. OSPF will prefere routes in the following order:
1. Intra-area
2. Inter-area
3. External
To fix this, you need routes across the PE network to be seen as Intra-area routes.
First, you will need to create a loopback on each PER. This loopback will need to be within the customer’s VRF:
PER1
interface Loopback1000
ip vrf forwarding customera
ip address 172.26.0.1 255.255.255.255
PER2:
interface Loopback1000
ip vrf forwarding customera
ip address 172.26.0.2 255.255.255.255
Next, you will need to advertise the loopback through BGP (within the VRF):
PER1:
router bgp 65000
  address-family ipv4 vrf customera
  no synchronization
  network 172.26.0.1 mask 255.255.255.255
  redistribute ospf 1000 vrf customera metric 10 match internal external 1 external 2
  exit-address-family
PER2:
router bgp 65000
  address-family ipv4 vrf customera
  no synchronization
  network 172.26.0.2 mask 255.255.255.255
  redistribute ospf 1000 vrf customera
  exit-address-family
Finally, you will need to create the SHAM link under the OSPF processes.
PER1:
router ospf 1000 vrf customera
log-adjacency-changes
area 0 sham-link 172.26.0.1 172.26.0.2
PER2:
router ospf 1000 vrf customera
log-adjacency-changes
area 0 sham-link 172.26.0.1 172.26.0.2
When you review the routes, you will see that they are now Intra-area, however the backdoor link is still preferred. Now you are able to modify the cost on the CERs.
CER1:
interface FastEthernet0/0
 ip address 192.168.1.1 255.255.255.252
 ip ospf cost 10000
CER2:
interface FastEthernet0/0
 ip address 192.168.1.2 255.255.255.252
 ip ospf cost 10000
Check your routes again, save the config and you have a SHAM-LINK.
I hate waiting for Wireshark to load a 20+meg capture file to review RTP streams. Once it loads you browse to “Telephony > RTP > Show All Streams”. Then you wait for it analyze the RTP streams…..
If you have a fair amount of memory it might not be too horrible of a wait, but it can always be quicker. Especially for those who are dowloading captures from a remote capture point. Often you download 5-6 files before you find one with any RTP loss or massive amounts of jitter.
Using “tshark” from the CLI ( Windows or *Nix) you can set a read filter and show the RTP stream analysis in a few seconds. The syntax is “tshark -r <filename > -qz rtp,streams“. This process through the GUI takes about 3 minutes on my Windows Vista Laptop. Running through the Windows CLI it takes under 10 seconds.
After running this you are presented with the same output seen through “Telephony > RTP > Show All Streams” (GUI).
Of course this method doesn’t allow listen to the G.711 streams like you can through the GUI. The GUI has the eavesdropping capabilities that allow you to hear issues that occurred before packetization (Stream shows no loss, however audio sounds choppy). There is however a definite advantage to this method. Below a sample of the output :
[12:10:36][FSLab]$ tshark -r capture1.pcap -qz rtp,streams
========================= RTP Streams ========================
    Src IP addr  Port    Dest IP addr  Port       SSRC          Payload  Pkts         Lost   Max Delta(ms)  Max Jitter(ms) Mean Jitter(ms) Problems?
    192.168.3.38 23988    192.168.2.146 20000 0xFBD96BBC ITU-T G.711 PCMU   127     0 (0.0%)           20.07            0.03            0.02 X
   192.168.2.146 20000     192.168.3.38 23988 0x1D2E1E1A ITU-T G.711 PCMU   130     0 (0.0%)           23.48            0.43            0.07 X
    192.168.3.38 24016    192.168.2.146 20000 0x9F3C715C ITU-T G.711 PCMU   127     0 (0.0%)           20.16            0.03            0.02 X
   192.168.2.146 20000     192.168.3.38 24016 0x28781E1C ITU-T G.711 PCMU   130     0 (0.0%)           22.77            0.41            0.11 X
    192.168.3.38 23952    192.168.2.146 20000 0x173A4637 ITU-T G.711 PCMU   127     0 (0.0%)           20.07            0.03            0.02 X
   192.168.2.146 20000     192.168.3.38 23952 0x03C61E1E ITU-T G.711 PCMU   130     0 (0.0%)           20.32            0.11            0.08 X
    192.168.3.38 24012    192.168.2.146 20000 0x753488EF ITU-T G.711 PCMU   127     0 (0.0%)           20.09            0.03            0.02 X
    192.168.3.38 20372    192.168.2.146 20000 0xAB77B2B9 ITU-T G.711 PCMU   127     0 (0.0%)           20.19            0.04            0.02 X
   192.168.2.146 20000     192.168.3.38 20372 0x10021E47 ITU-T G.711 PCMU   130     0 (0.0%)          282.48           24.18            5.84 X
I’ve been using a lot of Wireshark display filters lately. When troubleshooting a 100MB capture file setting a filter to search for relevant data is a huge time saver. Below are some of the common filters that I use.
1. Searching for RTP Packets within a specified range that DO NOT have the DSCP field set to “46” or IP PREC 5.
(udp.port >=16384 and udp.port <= 32767) and not(ip.dsfield.dscp==46 or ip.tos.precedence==5)
2. Searches for RTP types other than G.711 or G.729. Why would I need this? If you are using Cisco NBAR to match packets in a class-map the “audio” and “video” keywords only match specific traffic. You can define payload types to match as well. For instance, DTMF is usually payload type 101, T.38 is another dynamic payload type.
not (rtp.p_type==0 or rtp.p_type==18)
3. Searches for SIP Packets that are not sourced from UDP port 5060 or TCP port 5060.
not (udp.srcport==5060 or tcp.srcport==5060) and sip
4. Searches for SIP packets that are not destined for UDP port 5060 or TCP port 5060.
not (udp.dstport==5060 or tcp.dstport==5060) and sip
5. Searches for a specific MPLS label that is not tagged with EXP 5.
mpls.label==123123 and not mpls.exp==5
Since implementing new monitoring tools I’ve noticed a lot of failed REGISTER events on our network. Our SBC would issue a 4XX back to the originating UA, however the attempts continue. At one point I saw 200 register messages per second from a single IP.
I started to look a bit deeper into the REGISTER packet and found that the User-Agent is always “friendly-scanner”.
REGISTER sip:x.x.x.x SIP/2.0
Via: SIP/2.0/UDP 127.0.0.1:5060;branch=z9hG4bK-226458594;rport
Content-Length: 0
From: "100"
Accept: application/sdp
User-Agent: friendly-scanner
To: "100"
Contact: sip:123@1.1.1.1
CSeq: 1 REGISTER
Call-ID: 3348663663
Max-Forwards: 70
After a quick search I found that this is related to a script called SipVicious.
The author of SipVicious has included a tool called svcrash.py to shutdown the script on the attacking server. This is the easiest route to shut down an attacker on a manual basis (You must assume that the attacker has not modified the python script, otherwise the below data is void).
Run svcrash.py on the server being attacked with the “-d” option set.
keith@lab1:~/Documents/sipvicious> ./svcrash.py -d 192.168.34.134
Attacking back 192.168.34.134:5060
Once the above is executed, the attacker should see the following on their server.
kcroxford@attacker:~/Desktop/sipvicious$ ./svcrack.py  -u10000 192.168.34.139
CRITICAL:root:Unhandled exception - please run same command with the -R option to send me an automated report
ERROR:root:Exception
Traceback (most recent call last):
File "./svcrack.py", line 460, in
sipvicious.start()
File "./svcrack.py", line 229, in start
self.getResponse()
File "./svcrack.py", line 175, in getResponse
crackeduser,crackedpasswd = _tmp
ValueError: need more than 1 value to unpack
WARNING:root:found nothing
If you have an Acme Packet SBC you can request a copy of BCP 520-0052-00 from their Support Engineers. This is the Acme Packet Best Current Practices on how to handle SIPVicious traffic. I believe that there is another way to handle this (which will exploit the weakness in svcrash.py) with a Header Manipulation Rule. If I can confirm this as an option, I will update this blog entry.
If you are running an OpenSips proxy I found that Advantia Voip Systems has a write up on dropping traffic with “friendly-scanner” within the User-Agent header.
All other SBCs :
This is the packet that svcrash.py generates :
SIP/2.0 200 OK
Via: SIP/2.0/UDP 8.7.6.5:5061;branch=z9hG4bK-573841574;rport

Content-length: 0
From: "100"; tag=676f6f643a6279653a61747461636b65723a
User-agent: Telkom Box 2.4
To: "100"
Cseq: 1 REGISTER
Call-id: 469585712
Max-forwards: 70
If your SBC can automatically generate a similar response to the attacker, you should be able to stop the attack.
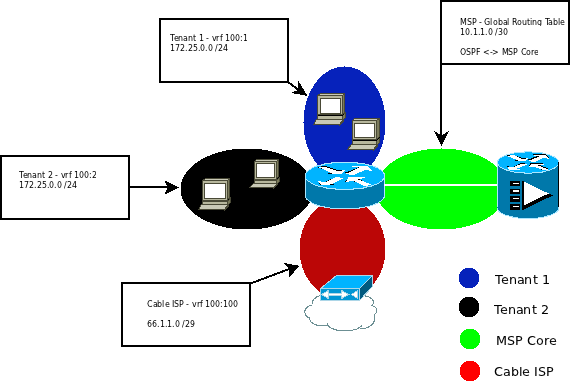
I recently had to create a configuration that contained multiple VRFs that all NAT/PAT out the same ISP connection. There is also a managed circuit that connects back to the Managed Service Provider (MSP) for management. All dynamic routing configs will need to be placed in the global routing table (default vrf). For this example, assume that the MSP is in the GRT.
To begin, we need to define our vrfs. For this example I will use the following :
ip vrf TENANT1 route-distinguisher 100:1
ip vrf TENANT2 route-distinguisher 100:2
ip vrf INTERNET route-distinguisher 100:100
We also need to enable the firewall for all of the VRFs that need Internet access:
ip firewall vrf TENANT1
ip firewall vrf TENANT2
ip firewall vrf INTERNET
Now we can configure our interfaces:
interface vlan 1
ip vrf forwarding TENANT1
description TENANT1 – LAN
ip address 172.25.0.1 255.255.255.0
interface vlan 2
ip vrf forwarding TENANT2
description TENANT2 – LAN
ip address 172.25.0.1 255.255.255.0
interface vlan 100
ip vrf forwarding INTERNET
description Cox Communications – INTERNET
ip address 66.1.1.2 255.255.255.248
We need to set a default route for the TENANT VRFs. We need an egress interface or IP address for this. As traffic is going to the same physical device, we must first configure a few loopback interfaces.
interface loopback 1
ip vrf forwarding TENANT1
description TENANT1 – Internet Route
ip address 1.1.1.1 255.255.255.255
interface loopback 2
ip vrf forwarding TENANT2
description TENANT2 – Internet Route
ip address 1.1.1.1 255.255.255.255
Then add the routes – Notice that the TENANTS both route to 1.1.1.1 as it is contain in both VRFs.
ip route vrf TENANT1 0.0.0.0 0.0.0.0 1.1.1.1
ip route vrf TENANT2 0.0.0.0 0.0.0.0 1.1.1.1
ip route vrf INTERNET 0.0.0.0 0.0.0.0 66.1.1.1
We can now configure an ACL to specify source traffic to NAT overload (PAT). Again, both VRFs have the same IP space.
ip access-list extended NAT
permit ip 172.25.0.0 0.0.0.255 any
Now confgure a policy-class to map to the above ACL :
ip policy-class TENANT1_NAT_OUT
nat source list NAT interface vlan 100 overload
ip policy-class TENANT2_NAT_OUT
nat source list NAT interface vlan 100 overload
Next we need to add an “access-class” to the source interfaces. This will map the interface to the policy-class.
interface vlan 1
access-class TENANT1_NAT_OUT
interface vlan 2
access-class TENANT2_NAT_OUT
Clear the policy-sessions, then attempt to access the internet from a device in VLAN 1, or 2. I’ll add another section to this later than explains how to configure DHCP pools per VLAN.
SUMMARY (Please excuse the diagram.. it was made in Dia and not Visio)
ip firewall vrf TENANT1
ip firewall vrf TENANT2
ip firewall vrf INTERNET
ip vrf TENANT1 route-distinguisher 100:1
ip vrf TENANT2 route-distinguisher 100:2
ip vrf INTERNET route-distinguisher 100:100
interface vlan 1
ip vrf forwarding TENANT1
description TENANT1 – LAN
access-class TENANT1_NAT_OUT
ip address 172.25.0.1 255.255.255.0
interface vlan 2
ip vrf forwarding TENANT2
description TENANT2 – LAN
access-class TENANT2_NAT_OUT
ip address 172.25.0.1 255.255.255.0
interface vlan 100
ip vrf forwarding INTERNET
description Cox Communications – INTERNET
ip address 66.1.1.2 255.255.255.248
interface loopback 1
ip vrf forwarding TENANT1
description TENANT1 – Internet Route
ip address 1.1.1.1 255.255.255.255
interface loopback 2
ip vrf forwarding TENANT2
description TENANT2 – Internet Route
ip address 1.1.1.1 255.255.255.255
ip route vrf TENANT1 0.0.0.0 0.0.0.0 1.1.1.1
ip route vrf TENANT2 0.0.0.0 0.0.0.0 1.1.1.1
ip route vrf INTERNET 0.0.0.0 0.0.0.0 66.1.1.1
ip access-list extended NAT
permit ip 172.25.0.0 0.0.0.255 any
ip policy-class TENANT1_NAT_OUT
nat source list NAT interface vlan 100 overload
ip policy-class TENANT2_NAT_OUT
nat source list NAT interface vlan 100 overload
Often a phone call (or data stream) can span multiple capture files. This is especially true when setting a small file size in your CLI capture syntax. Mergecap will allow you to merge multiple files into one.
Assuming that mergecap is in your PATH, you can execute the following:
mergecap -w OUTPUTFILE .pcap inputfile1.pcap inputfile2.pcap inputfile3.pcap
You can also use regular expressions to cut down the amount of typing.
In the below image, I used ls, awk and grep to cut out file permissions from the output. Don’t worry about that. Just notice that I have four files that match the expression. Three of the four files are roughly 20M each. The other file is 142K.
I then executed the mergecap program and specified “mergefile.pcap” as the output filename. After the output name I have specified which files to use as the input. Notice that I used a regular expression to match all files that contain with “85848_BRAU_125 and then have 0, 1 , 2 or 3 as the next character in the name.
About 3 seconds later the files are merged. Note: This is MUCH quicker than merging from the GUI Wireshark screen.

After the merge I have a single file of 59M.
The Cisco ASA includes a nice feature called “capture”. This feature does exactly as it is named, it captures traffic. From a managed service provider (MSP) perspective it becomes valuable tool as you can obtain a capture file, without deploying a laptop or capture server to the customer premises. This will provide similar data as a “debug ip packet <acl-name> on a Cisco router.
One caveat is that traffic must traverse through a layer 3 interface. If you want to troubleshoot LAN to LAN connections within the same broadcast domain.. you’re out of luck.
I supposed that it is possible to create a new vlan, assign it to an interface and then build a SPAN session on a switch with the destination pointing to this port. Alas, I haven’t had the opportunity to try it.
Enough digressing..
Assuming that you are running version 8.2 or older (I haven’t touched 8.3 yet) you can start a capture in the following manner.
1. You need to create an access-list. I prefer extended ACLs to limit what I will receive in the capture. Notice that I am using object groups.
lab-firewall(config)#access-list capture1 extended permit icmp any object-group remote_peer
lab-firewall(config)#access-list capture1 extended permit icmp object-group remote_peer any
lab-firewall(config)#access-list capture1 extended permit ip any object-group remote_peer
lab-firewall(config)#access-list capture1 extended permit ip object-group remote_peer any
2. Next we will use the “capture” command in the following manner “capture <capture-name> interface <interface-name> access-list <acl-name>.
lab-firewall(config)# capture CAPTURE1 interface inside access-list capture1
4. You can execute “show capture” to review generic statistics about the capture. This will basically show if we have captured any bytes and regurgitate what you entered above.
lab-firewall# show capture
capture CAPTURE1 type raw-data access-list capture1 interface inside [Capturing - 820 bytes]
5. Executing “show capture <capture-name>” will show you the source, destination and window sizes.
lab-firewall# show capture CAPTURE1
18 packets captured
   1: 19:56:55.064785 802.1Q vlan#101 P0 10.251.8.57 > 192.168.1.33: icmp: echo request
   2: 19:56:58.449393 802.1Q vlan#101 P0 192.168.4.111.2757 > 192.168.1.33.80: R 942165924:942165924(0) ack 3378665272 win 0
   3: 19:56:58.449668 802.1Q vlan#101 P0 192.168.4.111.2756 > 192.168.1.33.80: R 905288765:905288765(0) ack 3370140021 win 0
   4: 19:57:00.062542 802.1Q vlan#101 P0 10.251.8.57 > 192.168.1.33: icmp: echo request
   5: 19:57:05.065609 802.1Q vlan#101 P0 10.251.8.57 > 192.168.1.33: icmp: echo request

18 packets shown
6. Executing “show capture <capture-name> detail will also display the MAC address, ethertype (0x8100 = dot1q) and ttl information.
lab-firewall# show capture CAPTURE1  detail
43 packets captured
   1: 19:56:55.064785 c47d.4f80.e900 0000.0c07.ac01 0x8100 78: 802.1Q vlan#101 P0 10.251.8.57 > 192.168.1.33: icmp: echo request (ttl 128, id 27232)
   2: 19:56:58.449393 c47d.4f80.e900 0000.0c07.ac01 0x8100 58: 802.1Q vlan#101 P0 192.168.4.111.2757 > 192.168.1.33.80: R [tcp sum ok] 942165924:942165924(0) ack 3378665272 win 0 (DF) (ttl 128, id 40509)
   3: 19:56:58.449668 c47d.4f80.e900 0000.0c07.ac01 0x8100 58: 802.1Q vlan#101 P0 192.168.4.111.2756 > 192.168.1.33.80: R [tcp sum ok] 905288765:905288765(0) ack 3370140021 win 0 (DF) (ttl 128, id 40510)
   4: 19:57:00.062542 c47d.4f80.e900 0000.0c07.ac01 0x8100 78: 802.1Q vlan#101 P0 10.251.8.57 > 192.168.1.33: icmp: echo request (ttl 128, id 27235)
   5: 19:57:05.065609 c47d.4f80.e900 0000.0c07.ac01 0x8100 78: 802.1Q vlan#101 P0 10.251.8.57 > 192.168.1.33: icmp: echo request (ttl 128, id 27238)
7. Executing “show capture <capture-name> dump with display raw data in HEX.
lab-firewall# show capture CAPTURE1 dump
81 packets captured
   1: 19:56:55.064785 802.1Q vlan#101 P0 10.251.8.57 > 192.168.1.33: icmp: echo request
0x0000   0065 0800 4500 003c 6a60 0000 8001 e451        .e..E..<j`.....Q
0x0010   0afb 0839 cfba 0921 0800 e36d 0001 69ed        ...9...!...m..i.
0x0020   6162 6364 6566 6768 696a 6b6c 6d6e 6f70        abcdefghijklmnop
0x0030   7172 7374 7576 7761 6263 6465 6667 6869        qrstuvwabcdefghi
   2: 19:56:58.449393 802.1Q vlan#101 P0 192.168.4.111.2757 > 192.168.1.33.80: R 942165924:942165924(0) ack 3378665272 win 0
0x0000   0065 0800 4500 0028 9e3d 4000 8006 638f        .e..E..(.=@...c.
0x0010   cfb8 506f cfba 0921 0ac5 0050 3828 4fa4        ..Po...!...P8(O.
0x0020   c962 5738 5014 0000 0351 0000                  .bW8P....Q..
8. If you want to skip to a certain section of the capture and display only a small number of packets, you can use the count and packet-number options.
lab-firewall# show capture CAPTURE1 count  5 packet-number 23
105 packets captured
  23: 19:57:41.670314 802.1Q vlan#101 P0 192.168.4.111.2760 > 192.168.1.33.80: S 650507319:650507319(0) win 65535 <mss 1380,nop,nop,sackOK>
  24: 19:57:41.732460 802.1Q vlan#101 P0 192.168.1.33.80 > 192.168.4.111.2760: S 3438734250:3438734250(0) ack 650507320 win 5840 <mss 1378,nop,nop,sackOK>
  25: 19:57:41.762808 802.1Q vlan#101 P0 192.168.4.111.2760 > 192.168.1.33.80: . ack 3438734251 win 65535
  26: 19:57:41.771429 802.1Q vlan#101 P0 192.168.4.111.2760 > 192.168.1.33.80: P 650507320:650507954(634) ack 3438734251 win 65535
  27: 19:57:41.837755 802.1Q vlan#101 P0 192.168.1.33.80 > 192.168.4.111.2760: . ack 650507954 win 6974
I completed the final test of the CCNP track last Friday. This should provide me with more time for content.